Sales and warehousing performance
forecast for eCommerce retailer

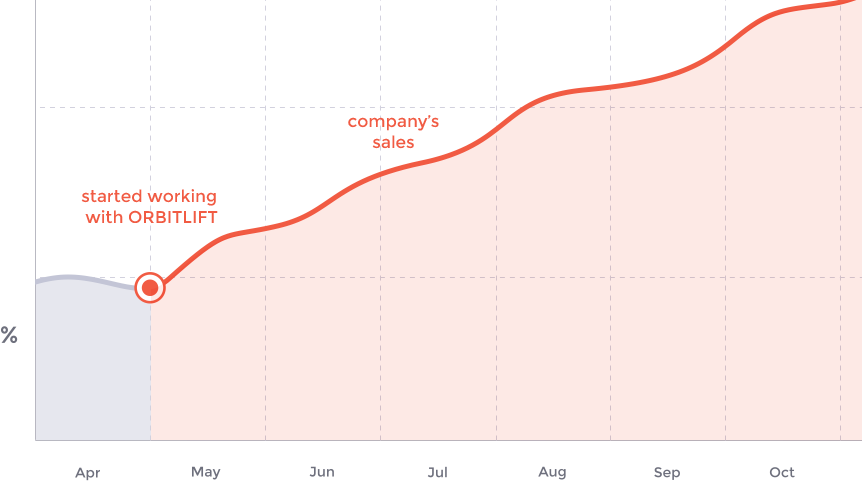
How we managed to improve sales by 20%
and achieve 15% decrease of average warehousing time.

With the permission of our client, we are glad to share this case of sales growth forecast for the online gift shop retailer. According to the client’s information confidentiality policy, we withhold the company’s name and some data. Nevertheless, we are ready to share with our prospective customers some insights into the challenges we faced, and solutions we found in cooperation with the e-retailer to boost their eCommerce business.

The Challenge

An eCommerce company specializing in selling gifts approached us with a challenge to optimize their warehousing capacities and increase their overall sales. The online retailer’s business is peculiar in many ways as it specializes in offering one-of-a-kind personalized gifts for festive occasions such as birthdays, anniversaries, Christmas, Mother’s Day and others.


The product categories vary a lot starting from exclusive and unusual postcards, stationeries to gym equipment for home and vehicle accessories. Most of these offers are unique to the store, and many of the promotional articles become viral from time to time. However, this causes large demand and stock fluctuations, as after a product’s rapid sales growth, its purchases can decrease significantly in a very short time span and vice versa. Consequently, some of the goods go out of stock when they are still in high demand, while some new original ones are introduced in the product line without much success. Before we start to improve the online stance of any business, we advise the company’s management to read through our e-Commerce strategy guide.

The main objective of our analysis was to create such a mathematic model that would help us in predicting online sales rates and minimize the storage time of goods and increase their turnover. This would help the company optimize their warehousing by ordering right quantities of various goods that would be sold out quickly enough to free up space for the new arrivals. More on this topic you can read in our conversion rate strategy guide.

eCommerce company specializing in selling gifts
Solution

We built and tested a mathematical model to predict the monthly online sales of each product category. With this model, we could take thousands of suppliers’ products, find those with the highest demand and highest potential sales and prepare a short-list. So if the smart analysis predicts a high interest in home gym equipment with the sales of 50 units per day and only ten original pens per day, we would create a plan to pre-order the stock accordingly.

Solution

The company has been present on the US market for three years now, and we were faced with a challenge not only to gather new data but to analyze the existing one. We focused on the following important parameters:

  • product features such as the name, size (height, width), description, purchase price, selling price, category, sub-category, age group, potential customer sex (female, male or unisex), materials, etc
  • monthly online sales figures for the first 12 months after each product was launched
  • major advertising campaigns (including date ranges)
  • access to Google Analytics statistics to get measurements about unique visitors for each product page by date
  • operation of different affiliate and discount programs.

After having strategic sessions with the business’ representatives and conversion experts, we additionally included the following important parameters (indicators):

  • product novelty (number of months the product has been on the market)
  • product popularity (rated from 1 to 10)
  • the degree of competition (rated from 1 to 10)
  • proximity to a competitive price (percentage)
  • price margin
  • seasonality (what months are the best for sales of the product)
  • renewability of consumption (yes or no)
  • age group of consumers (list of groups).

Overall, we focused on more than 30 parameters to work with to create a very precise predictive model. Our next task was to properly organize the data and choose the right computation model.

Results

The process of replacing a legacy system with a new one while it was operating and servicing multi-million customer flow was challenging, to say the least. We succeeded in minimizing the downtime and limited it to low-peak hours to affect the minimum number of clients.


Choosing the computation model

It’s not a secret that there is no single model to achieve all preset objectives. That’s why a very important part of the data science activities are connected with the process of choosing the optimal model for specific domains and cases, and working with the given parameters to decrease errors. The quality of each model we tested was computed by scoring errors (in percentages). We set error margins as a ratio of the difference between predicted and real results. This way we achieved our goal to minimize the percentage of errors.

Data preparation

With the mathematic model, we used three types of data: dates, quantitatives, and categoricals. Some parameters we employed directly without making any changes, others needed to be specifically prepared. For instance, in some cases, we added derivative variables such as date ranges. With the advertising campaigns, it is important to know the number of promotional dates, and not so much when they started and ended. This information can strongly influence the potential sales

Summary

A logical extension of OrbitLift’s work was the implementation of Business Intelligence tools to optimize online sales. The process of set up is ongoing with expected positive long-term results in predictions of stock and revenue for future months. It helps the business analysts to prepare a list of products with the highest demand and potential sales for their shop-front.

Business value of OrbitLift’s cooperation with the e-retailer is founded in the company’s increased sales during a six months period by 20 percent. Furthermore, the average time of warehousing for all products was decreased by 15 percent. The cooperation between our companies is ongoing.

20%

INCREASED
SALES

15%

DECREASED AVERAGE
TIME OF WAREHOUSING

optimize online sales
Whatever your challenge we are here to solve it!